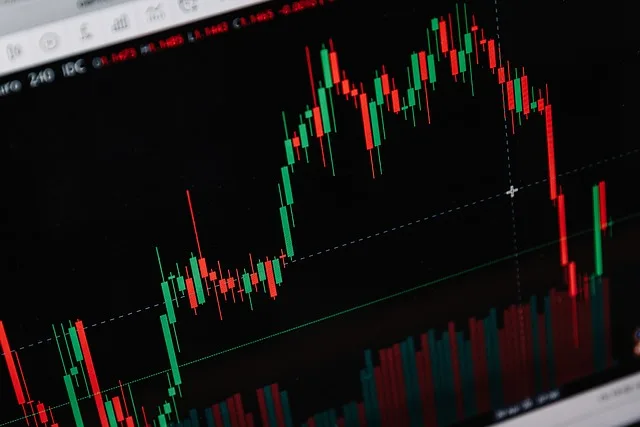
Welcome to the world of candlestick patterns, where centuries-old techniques merge seamlessly with modern trading strategies. Among the numerous candlestick formations that have stood the test of time, the “Bearish Harami Candlestick Pattern” emerges as a pivotal tool for traders seeking to navigate market shifts.
Crafted by market experts, this guide brings you comprehensive insights into this pattern, empowering you with the knowledge to make informed trading decisions.
Understanding the Bearish Harami Candlestick Pattern
Let’s embark on an enlightening journey into the realm of candlestick patterns. At its core, the Bearish Harami is a two-candle pattern that embodies the essence of market sentiment reversal. The word “Harami” itself translates to “pregnant” in Japanese, reflecting the pattern’s visual representation.
The Bearish Harami unfolds as follows:
Initial Candle
The first candle in the pattern is typically a large bullish candle, indicating a prevailing uptrend. This candle represents the dominance of buyers in the market.
Secondary Candle
The second candle, often a smaller bearish one, nestles within the range of the preceding candle. This candle’s body is engulfed by the body of the previous candle. This signifies a potential weakening of the bullish trend.
Decoding the Bearish Signal
The Bearish Harami candlestick pattern carries profound implications for market sentiment. The juxtaposition of the bullish and bearish candles serves as a visual metaphor for the changing power dynamics between buyers and sellers. This pattern presents an opportunity to catch a potential trend reversal, enabling traders to position themselves strategically.
How to Spot a Bearish Harami Candlestick Pattern
Identifying a Bearish Harami amidst the myriad of candlestick formations requires a trained eye. Here’s a step-by-step breakdown to guide you:
Observation
Start by identifying a prevailing uptrend marked by a bullish candle.
Confirmation
Look for the subsequent candle that closes lower than its open, denoting a shift toward bearish sentiment.
Engulfment
Ensure that the bearish candle’s body is fully engulfed within the range of the prior bullish candle, cementing the pattern’s essence.
The Power of Real-Time Examples
Nothing solidifies understanding more than real-world examples. Imagine you’re tracking an ascending market, and suddenly, a bearish harami candlestick pattern emerges. This could be your cue to assess the evolving dynamics. Consider a stock that has enjoyed consistent gains.
The first candle represents this bullish journey, followed by a smaller bearish candle that nestles within the first candle’s range. This signals a potential trend reversal, and astute traders may choose to capitalize on this insight.
Frequently Asked Questions
How reliable is the bearish harami Candlestick pattern?
The bearish harami candlestick pattern is renowned for its reliability in indicating potential trend reversals. However, like any tool in trading, it’s essential to consider it within the broader context of technical analysis.
Can the pattern appear on any timeframe?
Yes, the bearish harami candlestick pattern can manifest on various timeframes, from minutes to months. Its appearance remains consistent across different timeframes.
Should I solely rely on the bearish harami candlestick pattern for trading decisions?
While the bearish harami candlestick pattern provides valuable insights, successful trading involves considering multiple factors. Combine this pattern with other technical and fundamental analyses for a comprehensive strategy.
Elevating Your Trading Arsenal with the Bearish Harami Candlestick Pattern
As you embark on your trading journey, armed with the wisdom of the bearish harami candlestick pattern, remember that no single tool guarantees success. Technical analysis, including candlestick patterns, is a puzzle where each piece contributes to the overall picture. Just as a master painter blends hues to create a masterpiece, traders combine knowledge and intuition to navigate the markets.
In your pursuit of expertise, consider exploring further resources, such as those offered by The Market Technicians. This esteemed institution specializes in technical analysis and can provide you with deeper insights into the intricacies of market dynamics.
Conclusion
In the vast universe of trading strategies, the Bearish Harami Candlestick Pattern stands as a beacon of insight. Its ability to signal potential trend reversals empowers traders to make informed decisions, blending ancient wisdom with modern methodology. As you immerse yourself in this world of candlestick patterns, remember that success requires a combination of learning, experience, and a keen eye for patterns that influence market sentiment.
Affiliate link disclaimer: Some links in this article may earn us a commission for any resulting purchases. Thank you for supporting our content.


Your point of view caught my eye and was very interesting. Thanks. I have a question for you.