Are you ready to embark on a journey into the fascinating world of financial analysis? Brace yourself as we introduce you to the concept of the Harami Cross, a remarkable phenomenon that has captivated the minds of market experts and traders alike.
In this article, we will delve into the depths of the Harami Cross, exploring its significance, uncovering its patterns, and understanding how it can be harnessed to make informed trading decisions.
What is the Harami Cross?
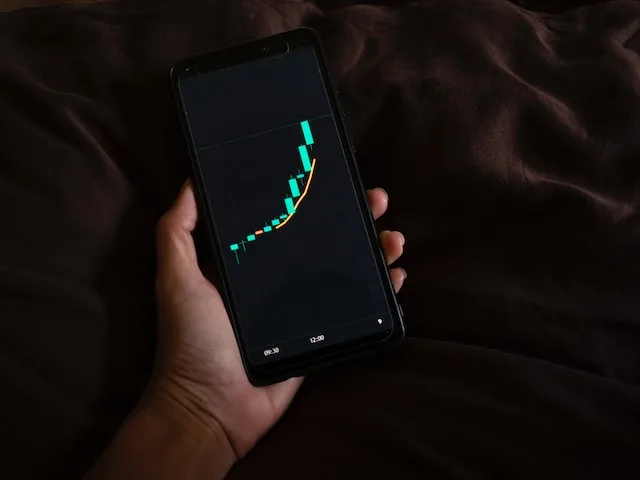
At its core, the Harami Cross is a candlestick pattern that emerges on price charts, specifically in the realm of technical analysis. This pattern is characterized by a small candlestick (referred to as the “inside” candle) that is encompassed within the body of a larger candlestick (known as the “outside” candle).
The intriguing twist lies in the cross-like appearance of the inside candle, which sets the stage for potential shifts in market sentiment.
Identifying the Harami Cross Pattern
Recognizing the Harami Cross is akin to deciphering a cryptic message from the market. The inside candle’s open and close fall within the boundaries of the outside candle’s body, creating a visual of a cross within a larger candle.
This distinctive formation hints at a potential reversal of the prevailing trend, making it a vital tool for traders seeking to anticipate market movements.
The Story Behind the Cross
Imagine the Harami Cross as a turning point in a story—a moment of pause and reflection before a new chapter unfolds. When this pattern emerges after a prolonged uptrend or downtrend, it symbolizes indecision and uncertainty in the market.
This indecision can foreshadow an imminent reversal, as traders reevaluate their positions and sentiments shift.
Gauging Momentum Shifts
One of the most captivating aspects of this candlestick pattern is its ability to reveal shifts in momentum. A bullish Harami Cross, where the inside candle is an upward shift, suggests that bears are losing their grip, and bulls might soon take the reins.
Conversely, a bearish Harami Cross, featuring a downward inside candle, indicates waning bullish momentum and the potential for bears to regain control.
The Harami Cross and Risk Management
Effective risk management is the cornerstone of successful trading. This pattern, with its predictive potential, offers traders an opportunity to fine-tune their risk management strategies. By recognizing this pattern early on, traders can set tighter stop-loss levels and mitigate potential losses in the event of a trend reversal.
Combining with Other Indicators
The true magic of this hero is unveiled when it dances in harmony with other technical indicators. Pairing this candlestick with tools like moving averages, relative strength index (RSI), or Fibonacci retracements can provide a more comprehensive view of the market landscape. This synergy can enhance the accuracy of predictions and lend further credence to potential trend reversals.
Frequently Asked Questions
Can the Harami Cross be used in different timeframes?
Absolutely! This pattern can be spotted in various timeframes, from intraday charts to weekly analyses. Its potency remains consistent across these timeframes, offering traders flexibility in their trading strategies.
Is the Harami Cross suitable for all markets?
Indeed, this candlestick pattern is not confined to a specific market. It can be observed in stocks, forex, commodities, and more. Its versatility is a testament to its relevance and influence in the world of technical analysis.
Are there instances where the Harami Cross may not lead to a reversal?
While this reversal pattern is a reliable indicator, no tool is infallible. There might be occasions where a reversal does not materialize. This underscores the importance of combining the Harami Cross with other indicators for a well-rounded analysis.
Conclusion: Unleashing the Potential with Expert Insights
As we conclude this journey through the intricacies of the Harami Cross, we invite you to further explore the vast realm of technical analysis. If you’re eager to dive deeper and gain a comprehensive understanding of market trends, we recommend checking out The Market Technicians. This resource is a treasure trove of expert insights, offering a wealth of knowledge to empower your trading endeavors.
In your pursuit of financial success, remember that the Harami Cross is not just a pattern on a chart—it’s a window into the minds of traders, a testament to the ebb and flow of market sentiment. By harnessing the power of this cross, you join the ranks of those who can navigate the markets with greater precision and confidence. Embrace the cross, and let it guide you toward informed and calculated trading decisions.
The world of trading awaits—go forth and conquer with the wisdom of the Harami Cross as your guide!
Affiliate link disclaimer: Some links in this article may earn us a commission for any resulting purchases. Thank you for supporting our content.


Thank you for your sharing. I am worried that I lack creative ideas. It is your article that makes me full of hope. Thank you. But, I have a question, can you help me?
Thank you for your sharing. I am worried that I lack creative ideas. It is your article that makes me full of hope. Thank you. But, I have a question, can you help me?