In the ever-changing landscape of financial markets, mastering star candlesticks can be the key to unlocking profitable trading opportunities. These patterns hold the potential to signal trend reversals and provide valuable insights for market analysis.
This comprehensive article aims to unveil 7 powerful secrets of star candlesticks that can empower traders with the knowledge needed to make informed decisions. Let’s dive into the world of stars and candlestick patterns and discover the secrets that can lead to trading success.
Table of Contents
- 1. Understanding the Significance of Candlestick Patterns
- 2. Star Candlesticks: An In-Depth Exploration
- 3. Morning Star Pattern: Shedding Light on Lucrative Opportunities
- 4. Evening Star Pattern: Embracing Dusk for Profitable Trades
- 5. Shooting Star Pattern: Capturing Shooting Opportunities in the Sky
- 6. Doji Star Pattern: Finding Balance in Market Analysis
- 7. Conclusion: Unlocking the Secrets for Trading Success
1. Understanding the Significance of Candlestick Patterns
1.1 Introduction to Candlestick Charts: Building the Foundation
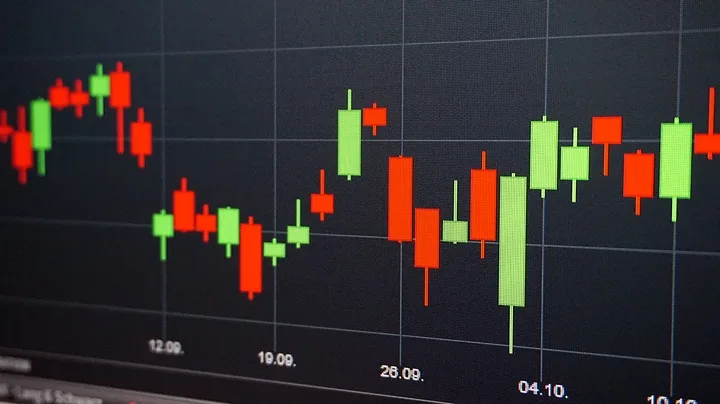
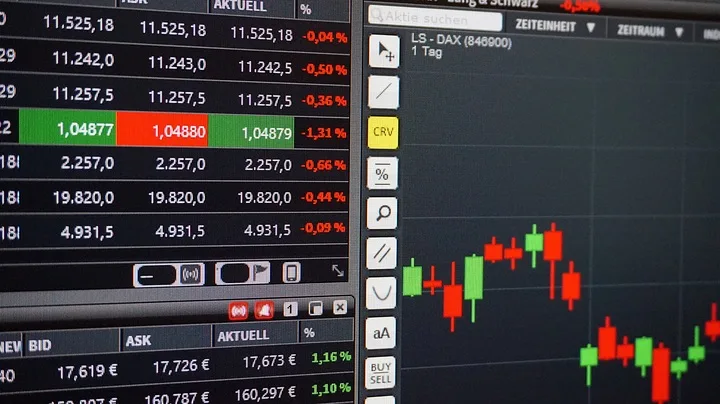
Candlestick charts provide traders with a visual representation of price movements, offering insights into market sentiment. Stars candlestick patterns, with their unique formations, hold immense significance in identifying potential trend reversals and guiding trading decisions.
1.2 Unveiling the Power of Candlestick Patterns
Candlestick patterns, including stars candlestick patterns, are valuable tools for traders. By understanding and interpreting these patterns, traders gain an edge in identifying entry and exit points, managing risk, and capturing profitable opportunities in the market.
2. Star Candlesticks: An In-Depth Exploration

2.1 Decoding Star Candlesticks: What You Need to Know
Star candlesticks consist of three candlesticks, with the middle candlestick referred to as the “star.” These unique formations found in these patterns indicate a lack of consensus in the market and offer valuable insights into possible changes in price trends.
2.2 The Magnitude of Stars: Unveiling Different Types of Patterns
Star candlesticks encompass various types, each with its own characteristics and implications. From the morning star pattern to the evening star pattern, shooting star pattern, and doji star pattern, understanding their unique features equips traders with a broader arsenal for market analysis.
3. Morning Star Pattern: Shedding Light on Lucrative Opportunities
3.1 Illuminating the Definition and Characteristics
The morning star pattern, a bullish reversal formation, emerges during a downtrend. It consists of three candlesticks: a bearish candlestick, a small-bodied star candlestick, and a bullish candlestick. The star candlestick gaps below the previous day’s close.
3.2 Guiding Your Path: Interpreting and Leveraging the Morning Star Pattern
The morning star pattern suggests a potential shift in market sentiment from bearish to bullish. Traders often view this pattern as a signal to enter long positions or to close existing short positions. Confirmatory indicators and price action analysis can enhance the reliability of this pattern.
4. Evening Star Pattern: Embracing Dusk for Profitable Trades
4.1 Unveiling the Definition and Characteristics
The evening star pattern, a bearish reversal formation, arises during an uptrend. It consists of three candlesticks: a bullish candlestick, a small-bodied star candlestick, and a bearish candlestick. The star candlestick gaps above the previous day’s close.
4.2 Navigating the Twilight: Interpreting and Capitalizing on the Evening Star Pattern
The evening star pattern indicates a potential shift in market sentiment from bullish to bearish. Traders may consider this pattern as a signal to enter short positions or to close existing long positions. Additional confirmation from other technical indicators strengthens the reliability of this pattern.
5. Shooting Star Pattern: Capturing Shooting Opportunities in the Sky
5.1 Unlocking the Definition and Characteristics
The shooting star pattern, a bearish reversal formation, manifests during an uptrend. It features a small real body located at the lower end of the candlestick, with a long upper shadow. The shooting star pattern signals a potential failure of buyers to sustain control.
5.2 Aiming for Success: Interpreting and Harnessing the Power of the Shooting Star Pattern
The shooting star pattern suggests a shift in momentum from buyers to sellers. Traders may consider this pattern as a signal to enter short positions or to tighten stop-loss levels. Confirmation from other technical indicators and price action analysis enhances the reliability of this pattern.
6. Doji Star Pattern: Finding Balance in Market Analysis
6.1 Balancing Act: Understanding the Definition and Characteristics
The doji star pattern emerges when the star candlestick is a doji, with opening and closing prices nearly equal. Doji candlesticks represent market indecision and often indicate potential trend reversals.
6.2 The Yin and Yang: Interpreting and Leveraging the Doji Star Pattern
The doji star pattern suggests uncertainty in the market and potential trend reversals. Traders may wait for confirmation signals such as bearish or bullish candlestick formations, trendline breaks, or violations of support and resistance levels before considering trading positions.
7. Conclusion: Unlocking the Secrets for Trading Success
By mastering the secrets of star candlesticks, traders gain a valuable edge in market analysis. These patterns provide insights into potential trend reversals and can guide trading decisions with greater precision. It is important to combine candlestick patterns with other technical indicators, risk management strategies, and market context for enhanced trading success.
For further exploration of candlestick patterns and other technical analysis techniques, traders can visit “The Market Technicians” website. This reputable source offers a wealth of information, educational resources, and insights into market analysis. By staying informed and continuously learning, traders can further refine their skills and stay ahead in the ever-evolving world of financial markets.
How many types of star candlesticks are covered in this article?
This article covers various types of star candlesticks, including the morning star, evening star, shooting star, and doji star patterns.
Can stars be applied to any financial market?
Yes, star candlesticks can be applied to various financial markets, including stocks, forex, commodities, and more.
Are stars patterns reliable indicators of market reversals?
Star candlesticks are considered reliable indicators, but it is recommended to use them in conjunction with other technical analysis tools for confirmation and increased accuracy.
How can traders leverage star candlesticks for profitable trades?
Traders can leverage star patterns by identifying the patterns, understanding their characteristics, and using them as signals for entry or exit points in trades. It is essential to combine them with proper risk management and analysis of the market context.
Can beginners effectively use these patterns in their trading strategies?
Yes, beginners can learn and incorporate star candlesticks into their trading strategies with proper education, practice, and understanding of market dynamics. It is advised to start with a solid foundation of candlestick analysis before diving into star candlestick patterns.
Revealing 7 Powerful Secrets of Star Candlesticks for Profitable Market Analysis equips traders with valuable knowledge to navigate the complexities of the financial markets. By understanding and utilizing these patterns effectively, traders can enhance their analysis, make informed decisions, and increase their chances of success in the dynamic world of trading.
Affiliate link disclaimer: Some links in this article may earn us a commission for any resulting purchases. Thank you for supporting our content.


Add a Comment